Author: Clare Louise

  • Self-Attention Heads and Scaled Dot-Product: Analysis of the mechanism that allows models to weight the importance of different parts of the input sequence

    Self-Attention Heads and Scaled Dot-Product: Analysis of the mechanism that allows models to weight the importance of different parts of the input sequence

    Modern language models need a reliable way to decide which parts of an input sequence matter most at any point in processing. In a sentence, the relevant information may be nearby (a modifier next to a noun) or far away (a subject that appears many tokens earlier). Self-attention solves this by letting each token “look at” other tokens and assign them different importance weights. This idea is central to Transformer models and is a core topic discussed in many curricula, including an AI course in Kolkata, because it explains why Transformers handle long-range dependencies better than older sequence models.

    Token representations and the Q, K, V idea

    Self-attention starts with token embeddings: vectors that represent each token after adding positional information (so the model knows token order). From each token’s current representation, the model creates three new vectors using learned linear projections:

    • Query (Q): what the token is looking for
    • Key (K): what the token offers as a match
    • Value (V): the information the token provides if selected

    You can think of this as a search process. Each token generates a query, compares it to keys from all tokens, and then gathers a weighted combination of values. Importantly, this is done in parallel for all tokens, which is a major performance advantage of Transformers.

    Scaled dot-product attention, step by step

    The “matching” between a query and a key is computed using a dot product. For a token i attending to token j, the compatibility score is:

    • score(i, j) = Qᵢ · Kⱼ

    These scores are converted into weights using a softmax so they sum to 1 across all tokens. The output for token i becomes a weighted sum of the value vectors:

    • Attention(Q, K, V) = softmax((QKᵀ) / √dₖ) V

    Why the scaling factor matters

    The division by √dₖ (where dₖ is the key dimension) is not decorative. When vector dimensions are large, dot products can become large in magnitude. Large values pushed through softmax can create extremely peaked distributions, which can lead to tiny gradients and unstable training. Scaling keeps scores in a range that helps the softmax behave more smoothly, improving optimisation and stability.

    Masks: controlling what a token can see

    In real systems, attention often uses masks:

    • Padding mask: prevents the model from attending to padding tokens.
    • Causal mask: used in autoregressive models so a token can only attend to earlier tokens, not future ones.

    These masks are typically applied by setting disallowed scores to a very negative number before softmax, forcing the corresponding weights toward zero.

    What self-attention heads add to the mechanism

    A single attention operation can capture useful relationships, but Transformers typically use multi-head attention. Instead of one set of Q, K, V projections, the model uses multiple sets, producing multiple attention “heads” in parallel. Each head has its own projection matrices and therefore its own way of comparing tokens.

    Why multiple heads help

    Different heads can specialise. In language tasks, one head might focus on local grammatical structure, while another might track long-range coreference. For example, in:

    The student who studied all night said they were tired.

    One head may connect “student” with “said” (subject-verb relation), while another may link “student” with “they” (coreference). This division of labour increases representational capacity without requiring a single attention map to do everything.

    A key caution about interpretation

    Attention heads are tempting to treat as direct explanations of model reasoning. They often provide insight, but they are not guaranteed to be faithful explanations. Downstream layers can transform and override signals, and some heads may look meaningful while contributing little. This is why serious analysis goes beyond simply plotting attention matrices, a nuance often emphasised in an AI course in Kolkata that covers both model mechanics and evaluation habits.

    Analysing attention in practice: what to measure and why

    To understand or debug attention behaviour, practitioners use a mix of visual and quantitative checks:

    • Attention heatmaps: reveal which tokens receive high weights. Useful for spotting obvious issues like heavy attention on padding or punctuation.
    • Entropy of attention distributions: low entropy means highly focused attention; high entropy means spread-out attention. Both can be valid depending on the layer and task.
    • Head importance tests: prune or ablate heads to see whether outputs degrade. Some heads are critical; others are redundant.
    • Layer-wise patterns: early layers often focus on local patterns, while later layers may capture broader semantic or task-driven relationships.

    These techniques help you move from “attention looks nice” to “attention contributes meaningfully.” If you are building real NLP systems, these habits matter as much as learning the formula, and they frequently appear in applied modules of an AI course in Kolkata.

    Conclusion

    Scaled dot-product attention is the computational core that lets tokens compare, select, and aggregate information from the entire sequence. The √dₖ scaling improves training stability, masks enforce valid visibility rules, and multiple attention heads expand the model’s ability to represent diverse relationships in parallel. When you analyse attention carefully using metrics like entropy, ablations, and layer patterns, you gain practical insight into how Transformers behave and where they fail. For learners aiming to work on modern NLP and generative models, mastering these ideas is a strong foundation, whether through self-study or a structured AI course in Kolkata.

  • Why International Schools in Dubai Are the Smart Choice for Global Families

    Why International Schools in Dubai Are the Smart Choice for Global Families

    Dubai has firmly established itself as one of the world’s most connected cities – a hub for business, culture, and talent from every corner of the globe. For the hundreds of thousands of families who call it home, education is not just a local concern. It is a global one. The school a child attends in Dubai may determine whether they are ready for a university in London, Sydney, Toronto, or Singapore.

    This is exactly why international schools with globally recognised curricula have become the first choice for so many families in the emirate.

    What Makes an International School Different?

    The term ‘international school’ can mean different things, but in Dubai’s context it typically refers to a school that follows a curriculum from outside the UAE – most commonly British, American, or IB – and caters primarily to an expatriate student body. These schools are designed to serve children who may have moved from another country, who hold passports from multiple nations, or whose parents are planning a future move elsewhere.

    The best international school in dubai will do more than deliver a foreign curriculum. It will create a genuinely global environment – one where students from dozens of nationalities learn alongside each other, develop cultural fluency, and build the interpersonal skills that matter deeply in an interconnected world.

    The Role of Curriculum in Long-Term Outcomes

    Curriculum choice shapes everything from daily classroom experience to university destination. The British curriculum – with its structured progression from early years through GCSEs to A-Levels – is particularly well-regarded for its academic rigour and its international portability. Students who complete A-Levels are competitive applicants at universities in the UK, the US, Australia, Europe, and beyond.

    For parents who are uncertain about where they will be in five years, a curriculum with global recognition offers enormous peace of mind.

    Early Years: Setting the Foundation Right

    For families with very young children, the quality of early years provision deserves as much scrutiny as secondary outcomes. A strong eyfs programme – built on play-based learning, communication, and emotional development – creates the conditions for lifelong academic success. Children who feel confident and curious at age four carry that foundation all the way through their schooling.

    Questions Every Parent Should Ask

    Before committing to any school, international families should ask the following:

    • What is the school’s KHDA inspection rating, and when was it last reviewed?
    • What percentage of graduates go on to top-tier universities?
    • How does the school support students who join mid-year from a different curriculum?
    • What pastoral and wellbeing support is in place?
    • How does the school communicate progress to parents?

    A City That Takes Education Seriously

    Dubai’s regulatory framework – overseen by the KHDA – means that schools are held to measurable, publicly reported standards. That accountability is a genuine advantage for parents. When you are choosing the best school in dubai for your family, you are not guessing. You are choosing from institutions that have been independently assessed, graded, and reported on. Use those reports. They are among the most valuable tools available to any parent navigating Dubai’s school landscape.

  • The New Reality of Reliability: Understanding Why Shift-Right Testing Is Becoming Essential

    The New Reality of Reliability: Understanding Why Shift-Right Testing Is Becoming Essential

    In the world of modern applications, software behaves like a massive railway network. No matter how many test tracks engineers build outside the city, nothing truly matches the chaos, rhythm, and unpredictability of real passengers, real schedules, and real weather. Traditional testing—conducted far from the bustle—is like sending empty trains around a quiet test loop. Useful, yes, but it can never replicate the heartbeat of the real world. This is where Shift-Right Testing emerges: a practice that puts trains on real tracks, with real people, while still ensuring safety, observation, and rapid response.

    The Rise of the Live Railway: Why Production Has Become the Ultimate Test Ground

    Applications today run in large, interconnected environments with microservices, APIs, distributed data, and global user traffic. Even the most carefully constructed pre-production setup cannot simulate real-world dynamics at full fidelity.

    Shift-Right Testing embraces this reality by treating production not as a dangerous zone but as a rich and authentic testing ecosystem. It operates with the philosophy that only real passengers—end users—can reveal certain behaviours: spontaneous spikes, unusual navigation paths, or unexpected system interactions.

    In one of the advanced modules highlighted during software testing coaching in pune, instructors often compare this shift to pilots who train with simulators but must also fly real aircraft under supervision to master the environment. The same logic applies here—real conditions expose real truths.

    Observability as the Railway Control Room

    Every bustling railway system needs a robust control room equipped with giant dashboards, blinking signals, and operators who monitor everything from train delays to weather disruptions. Observability plays this role in Shift-Right Testing.

    Instead of simply logging errors, observability tells the entire story of system health, allowing teams to answer questions such as:

    • How did the system behave under real peak load?
    • Did a new feature create ripples across other services?
    • What early-warning signals surfaced before an incident occurred?

    With metrics, distributed tracing, and intelligent dashboards, observability becomes a storytelling engine—one that narrates the past, present, and likely future of application performance.

    Feature Flags and Controlled Rollouts: Testing One Carriage at a Time

    Imagine testing a new train carriage by attaching it to just one train on a quiet route before deploying it across the entire network. Feature flags and controlled rollouts use this exact strategy.

    Teams can expose new features to:

    • 1% of the user base
    • A specific geography
    • A single customer cohort
    • Internal staff only

    This controlled exposure allows engineers to assess real-world performance without risking the stability of the entire system. If something feels off, the feature can be instantly turned off—like decoupling a malfunctioning carriage before it disrupts the entire fleet.

    This gradual approach has transformed product releases from risky events into predictable, reversible operations.

    Chaos Engineering: Stress-Testing the Tracks Under Real Conditions

    Modern systems must be resilient, not just functional. Chaos engineering introduces randomness and failure intentionally—just like inspectors who stress-test railway tracks with heavy machinery or simulate sudden blockages.

    By injecting scenarios such as:

    • Latency spikes
    • Database failures
    • Network cuts
    • Instance crashes

    teams learn how the system behaves under strain. Rather than waiting for incidents to appear naturally, they provoke failure in a controlled environment, observing how the system handles adversity. Chaos engineering turns fear into familiarity and uncertainty into preparedness.

    User Behaviour Insights: Learning From Real Passenger Journeys

    No simulation can predict how real commuters behave—how they crowd certain platforms, avoid unused tunnels, or rush in unexpected waves. Similarly, user behaviour analytics in production uncover surprising patterns:

    • Features users love but never asked for
    • Buttons users avoid despite careful UI design
    • Traffic coming from unexpected demographic segments
    • Performance issues tied to specific devices or networks

    These insights help teams redesign smarter, optimise performance, and prioritise updates based on real usage—not assumptions. It transforms testing from a checklist process into a living dialogue between users and developers.

    Such behavioural analysis is often explored in depth during hands-on learning in software testing coaching in pune, where learners observe how real-world interactions influence test strategies.

    Conclusion: The Shift-Right Mindset Is Not a Risk—It Is a Necessity

    Shift-Right Testing is not about abandoning caution or replacing traditional testing. It is about acknowledging that real systems live, grow, and evolve in ways test environments simply cannot predict.

    By embracing production as a valuable testing space, organisations gain:

    • Higher confidence in releases
    • Faster detection of issues
    • Richer insights into real user behaviour
    • Stronger system reliability
    • Greener deployments with fewer rollback events

    Just as railway networks rely on live data, controlled experiments, and real passenger interactions to run safely, modern software systems thrive when testing becomes an ongoing conversation with reality.

    Shift-Right Testing is not just becoming the norm—it is becoming the backbone of resilient, intelligent, user-centric digital ecosystems.

  • ETL/ELT Pipeline Optimisation: Performance Tuning and Scaling of Data Transformation Processes

    ETL/ELT Pipeline Optimisation: Performance Tuning and Scaling of Data Transformation Processes

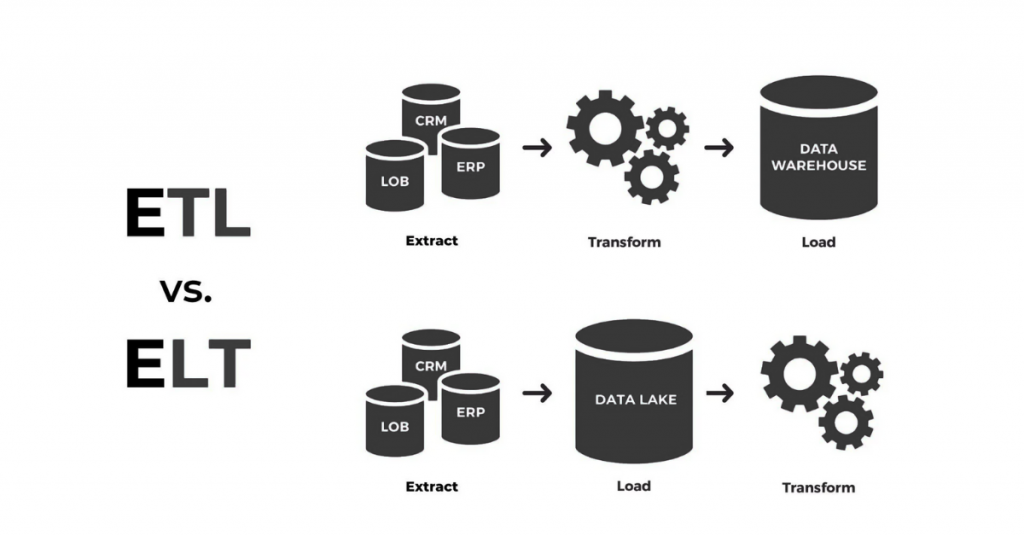
    In the modern data-driven world, information moves like water through pipelines—flowing from source systems to analytical platforms where it’s turned into insights. But as data volumes surge and systems become increasingly complex, those pipelines can experience “clogs” and inefficiencies. Optimising ETL (Extract, Transform, Load) and ELT (Extract, Load, Transform) processes is much like maintaining a high-pressure irrigation system: the goal is to ensure continuous, clean, and timely flow.

    When done right, optimisation ensures faster data movement, lower costs, and better decision-making for organisations that depend on analytics.

    Understanding the Flow of Data

    Every ETL or ELT pipeline acts as the circulatory system of a company’s data architecture. The extraction stage pulls data from diverse sources, the transformation stage refines it for analysis, and the loading stage stores it in a data warehouse or lake.

    However, performance bottlenecks often appear when datasets are massive or transformations are overly complex. Analysts and engineers must trace these “blockages” and address them through efficient code design, parallelism, and optimal resource utilisation.

    Professionals trained through a business analyst course in Pune often start by learning how to visualise this flow—understanding not just the data movement but also the business impact of each delay or inefficiency in the process.

    Identifying Bottlenecks in the Pipeline

    A critical first step in optimisation is diagnosing where inefficiencies occur. Bottlenecks can appear in several forms: slow network transfers, unindexed database joins, or poorly designed transformation logic.

    Think of it as identifying weak links in a chain—if one segment breaks, the entire operation suffers. Advanced monitoring tools like Apache Airflow, Talend, or AWS Glue offer dashboards that highlight slow tasks and failure points.

    The key lies in creating a feedback loop. Regular performance audits, coupled with automated alerts, ensure issues are detected before they affect reporting timelines or downstream systems.

    Techniques for Performance Tuning

    Performance tuning in ETL/ELT pipelines is both an art and a science. It involves fine-tuning configurations, rewriting inefficient queries, and optimising resource allocation.

    Batch size adjustments, parallel processing, and in-memory computation can drastically improve speed. Similarly, minimising unnecessary transformations and filtering data early in the pipeline prevents wastage of compute power.

    Caching frequently used datasets, using columnar storage formats like Parquet, and leveraging distributed computing frameworks (e.g., Apache Spark) make pipelines more scalable and resilient.

    Courses like the business analyst course in Pune often teach learners how to interpret these technical optimisations from a business perspective—understanding how faster, cleaner data directly improves decision-making efficiency.

    Scaling for Big Data Environments

    When an organisation grows, so does its data volume. Scaling ETL or ELT systems becomes a strategic priority to maintain efficiency without exploding costs.

    Cloud-based solutions have revolutionised this area. Tools like Google Dataflow, Azure Data Factory, and Snowflake offer elastic scalability—expanding capacity automatically as workloads increase. But scaling isn’t only about infrastructure; it’s also about intelligent architecture.

    Partitioning data, distributing workloads across clusters, and applying asynchronous processing enable pipelines to handle millions of records in near real-time. Scalability ensures continuity even during peak demand, keeping analytics dashboards up to date.

    Balancing Cost, Speed, and Reliability

    Every data team faces a fundamental trade-off—faster processing usually means higher costs. True optimisation strikes the right balance between speed, reliability, and budget.

    Cost-optimisation strategies include using serverless architectures that scale automatically, scheduling non-critical jobs during off-peak hours, and optimising query execution plans.

    Data reliability must never be compromised. Proper validation checks, error logging, and data lineage tracking ensure accuracy while maintaining velocity.

    When these principles come together, data pipelines not only become efficient but also trustworthy—empowering business leaders to make decisions with confidence.

    Conclusion

    Optimising ETL and ELT pipelines is about more than just technical tuning—it’s about designing systems that adapt, scale, and deliver value consistently. Like a finely tuned orchestra, every component—from extraction scripts to cloud clusters—must play in harmony to achieve peak performance.

    As businesses evolve and data continues to expand, professionals who understand how to streamline these systems will become indispensable. Investing in continuous learning and adopting industry best practices in data transformation will keep organisations ahead of the curve—ensuring their insights flow smoothly, reliably, and at the speed of decision-making.

  • Challenging Topics Made Simple in Primary 5 Tuition

    Challenging Topics Made Simple in Primary 5 Tuition

    Primary 5 is often seen as a make-or-break year in a student’s academic journey. With subjects becoming more complex and expectations rising, many students feel the pressure. Fortunately, primary 5 tuition can ease this burden by breaking down difficult topics into manageable, understandable parts. With the right support, students gain the skills and confidence needed to tackle even the toughest content.

    Why Primary 5 Is a Turning Point

    Heavier Academic Load and Higher Expectations

    The leap from Primary 4 to Primary 5 is significant. Students face longer exam papers, new question formats, and deeper subject content. Maths introduces more abstract problem-solving, Science expects stronger process skills, and English comprehension becomes more analytical. Without additional support, many students may struggle to keep pace, which is why tailored primary 5 tuition is increasingly relied upon.

    Preparing for PSLE Starts Now

    Although the PSLE happens in Primary 6, preparation unofficially begins in Primary 5. This year lays the groundwork for content mastery, time management, and exam confidence. Tuition programmes are designed to sharpen the core skills required for PSLE success, ensuring students are not overwhelmed in the final year.

    Breaking Down Complex Math Topics

    Mastering Fractions, Decimals, and Ratios

    Maths in Primary 5 introduces the deeper relationships between fractions, decimals, and ratios. These topics are often taught in a way that assumes students will naturally grasp the connection, but many require clearer explanations and guided practice. In tuition sessions, tutors use step-by-step strategies to help students understand these numerical relationships in a logical and visual way.

    Tackling Challenging Word Problems

    Multi-step word problems can be intimidating, especially when students are unsure how to begin. Tuition breaks down these questions by teaching students how to dissect the language, identify keywords, and apply the right concepts. Techniques like model drawing and logical sequencing are taught to make problem-solving more structured and less overwhelming.

    Understanding Geometry and Area Concepts

    Concepts like angles, area, and volume are introduced in more depth during this level. Many students struggle because these topics are abstract and require spatial reasoning. Through primary 5 tuition classes, students benefit from hands-on guidance using diagrams, visual aids, and repeated practice, making abstract concepts more tangible and easier to master.

    Making Science Concepts Easier to Digest

    Explaining Systems: Digestive, Circulatory, and Respiratory

    Science takes a major leap forward in Primary 5, with topics such as the human body systems becoming part of the curriculum. While textbooks may present these systems in lengthy blocks of text, tuition centres simplify them using labelled diagrams, everyday analogies, and storytelling techniques. This approach helps students retain information and apply it during open-ended questions.

    Strengthening Process Skills

    It’s not just content that matters; process skills like analysing data, observing changes, and drawing conclusions become critical. Tuition provides students with structured experiments, mock questions, and feedback to refine these skills. Tutors guide them on how to respond scientifically while sharpening their logical thinking.

    Answering Open-Ended Questions with Precision

    One of the most common challenges in Primary 5 Science is answering open-ended questions accurately and concisely. These questions require specific phrasing and correct scientific terms. Primary 5 tuition teaches students how to frame their responses properly, identify what the question is truly asking, and avoid common mistakes in phrasing and logic.

    Enhancing English Mastery

    Tackling Comprehension with Confidence

    Comprehension in Primary 5 tests a student’s ability to infer, summarise, and interpret meaning from more complex texts. Tuition sessions focus on breaking down passages, recognising question types, and developing strategies for answering effectively. This helps students feel less intimidated by lengthy passages and improves overall understanding.

    Composition Writing with Structure and Creativity

    Students are expected to write longer, more detailed compositions that are logically sequenced and creatively engaging. Tuition focuses on helping students plan their stories, develop richer plots, and use a wider range of vocabulary. Structured guidance ensures students avoid common pitfalls like abrupt endings or weak conclusions.

    Grammar and Synthesis Drills

    Primary 5 grammar topics become more technical, covering synthesis and transformation, connectors, and passive voice. These areas are often neglected in school due to time constraints. Through primary 5 tuition programmes, students receive targeted drills and clear explanations that improve both their written and spoken English.

    How Primary 5 Tuition Builds Confidence and Performance

    Personalised Pacing and Support

    Every child learns at their own pace. Tuition allows for customised lessons where tutors adjust the level of difficulty and focus areas depending on each student’s strengths and weaknesses. This level of attention often isn’t possible in large school classrooms.

    Consistent Practice and Feedback

    Success in Primary 5 doesn’t happen overnight. Regular tuition ensures that students consistently practise what they’ve learned and receive immediate feedback. This not only helps correct mistakes early on but also builds strong learning habits.

    Boosting Motivation Through Clarity

    When students finally understand a topic they once found difficult, it changes their attitude toward learning. Tuition removes the fog of confusion, making lessons more accessible and even enjoyable. With clearer understanding comes better performance, which in turn motivates students to keep improving.

    Conclusion

    Primary 5 can feel overwhelming, but it doesn’t have to be. With the help of effective primary 5 tuition, challenging topics become much simpler to grasp. Students receive the tools, techniques, and confidence they need to excel—not just in Primary 5, but well beyond.

  • What you should know about reloadable gift cards?

    What you should know about reloadable gift cards?

    Reloadable gift cards offer a flexible gifting solution beyond traditional one-time-use cards. These versatile payment tools allow you to add funds multiple times, creating lasting value for recipients who can use them repeatedly. Unlike standard gift cards that become worthless after the initial balance depletes, reloadable versions provide an on-going utility that makes them particularly appealing for frequent gift-givers. The ability to replenish funds transforms these cards into practical financial tools that recipients can rely on for various purchases throughout the year. Whether you’re supporting a family member’s monthly expenses or providing a teenager with spending flexibility, these cards adapt to different financial needs. With my-giftcardmall system demonstrates how reloadable options can simplify gift-giving while giving recipients genuine utility. The convenience factor appeals to givers who want lasting impact and receivers who appreciate flexible spending power.

    Reloading works

    The reloading process varies depending on the card type and issuer, but the basic principle remains consistent across different options. Most reloadable cards allow you to add funds online or in person, with limits protecting the cardholder and the financial institution.

    1. Online reloading typically requires account registration and verification
    2. In-store reloading often involves cash transactions with immediate fund availability
    3. Mobile app reloading provides convenient access from anywhere
    4. Automatic reloading can be set up for recurring fund additions
    5. Bank transfer reloading offers direct fund transfers from your accounts

    The reload limits vary greatly between different card programs. Some cards allow daily additions up to $500, while others permit larger amounts with proper verification. These constraints help you plan your gifting strategy accordingly.

    Monthly maintenance realities

    Reloadable gift cards often carry monthly fees that can gradually diminish the card’s value if left inactive. These maintenance charges help cover the administrative costs of keeping accounts active and providing customer support services. The fee structures differ widely between issuers, with some charging flat monthly rates while others implement tiered pricing based on usage patterns. Cards with higher initial loads sometimes waive maintenance fees for several months, providing better value for substantial gifts. Dormancy fees may apply after extended periods without activity, encouraging regular card usage.

     Smart gifting strategies

    Choosing the right reloadable card requires considering the recipient’s spending habits and your long-term gifting goals. Card types serve different purposes, from supporting college students to helping elderly relatives manage expenses.

    1. College students benefit from cards that work with campus dining and bookstore systems
    2. Teenagers appreciate cards accepted at popular retail and entertainment venues
    3. Elderly recipients often prefer cards with simple interfaces and customer support
    4. Frequent travellers need cards that work internationally without foreign transaction fees

    The key lies in matching card features with actual usage patterns rather than assuming all reloadable cards offer identical benefits.

    Balance management tactics

    Effective balance management ensures reloadable gift cards provide maximum value while avoiding unnecessary fees. Successful card management involves timing reload amounts with expected expenses while maintaining sufficient balances to cover monthly maintenance fees. Setting up balance alerts prevents unexpected declines while helping recipients track spending patterns. Some cardholders prefer maintaining minimum balances that cover several months of fees, ensuring the card remains active even during periods of reduced usage. Others reload smaller amounts more frequently to minimize potential loss or theft exposure. Their flexibility makes them particularly valuable for recipients who appreciate financial control and givers who want lasting impact.

  • How do you support your claims in an argumentative essay writing service?

    How do you support your claims in an argumentative essay writing service?

    When crafting an argumentative essay, the strength of your argument relies heavily on how well you support your claims. A well-structured essay with robust evidence and logical reasoning stands out among others. Creating compelling essays is partly dependent on the strength of your arguments and your ability to convince readers of your perspective.

    Power of evidence – Backing your statements

    Evidence forms the backbone of any strong argument without substantial proof, claims remain mere opinions that readers can easily dismiss. Begin by gathering various types of evidence, including:

    • Statistical data from credible research studies
    • Expert testimonials from authorities in the field
    • Historical examples demonstrating precedent
    • Case studies that illustrate your points in action
    • Direct quotations from primary sources

    The quality of evidence matters more than quantity. One well-researched study from a respected institution carries more weight than multiple questionable sources. Continually evaluate the credibility, relevance, and recency of your supporting material.

    Logical reasoning – Connecting claims and evidence

    Simply presenting evidence isn’t enough you must show how it relates to your claims. This requires logical reasoning that builds bridges between your assertions and supporting materials. Consider implementing these reasoning techniques:

    • Deductive reasoning- Starting with general principles and moving to specific conclusions
    • Inductive reasoning- Using specific examples to form general conclusions
    • Analogical reasoning- Drawing parallels between similar situations
    • Causal reasoning- Demonstrating cause-and-effect relationships

    Each piece of evidence should be followed by an analysis explaining its significance and connection to your main argument. This analytical component transforms raw data into persuasive support.

    Strategic organization – Structuring for impact

    How you organize supporting evidence significantly affects its persuasive power. Consider arranging your arguments in order of increasing strength, saving your most compelling evidence for last. This approach creates a crescendo effect that leaves readers with your strongest points fresh in their minds.

    The best essay writing service in us recognizes that well-structured arguments naturally guide readers through complex reasoning. Each paragraph should focus on one aspect of your argument, with clear transitions connecting related ideas. This logical progression helps readers follow your thinking and increases their likelihood of accepting your conclusions.

    Precise language – Eliminating ambiguity

    Vague claims undermine otherwise strong arguments. Use precise language that leaves little room for misinterpretation. Replace general terms with specific ones, and define potentially ambiguous concepts clearly. This precision helps prevent readers from misunderstanding your points or finding loopholes in your reasoning. For example, instead of many studies show, specify seven peer-reviewed studies published between 2018 and 2023. This specificity builds trust and demonstrates thoroughness in your research process.

    Considerations – Maintaining credibility

    Supporting claims ethically maintains your credibility as a writer. This means avoiding common pitfalls like:

    • Cherry-picking evidence that supports only your view
    • Misrepresenting source materials or taking quotes out of context
    • Exaggerating statistics or research findings
    • Using emotional manipulation instead of reasoned arguments
    • Attacking the character of those with opposing views rather than addressing their arguments

    Maintaining ethical standards throughout your argumentative essay ensures your work withstands scrutiny and earns respect from readers, regardless of whether they agree with your position. By implementing these strategies, you’ll create argumentative essays with well-supported claims that persuade readers. A good argument depends not just on what you claim but on how thoroughly and thoughtfully you justify those claims with evidence and reasoning.

  • Tableau Desktop vs. Server: Choosing the Right Tool

    Tableau Desktop vs. Server: Choosing the Right Tool

    Data visualization has become an essential aspect of business intelligence, helping organizations analyze and interpret large datasets efficiently. Tableau, popularly known as one of the most powerful data visualization tools, offers multiple versions, including Tableau Desktop and Tableau Server. Understanding the differences between these two can help businesses and professionals make the right choice based on their needs. A data analyst course provides in-depth knowledge of Tableau, helping professionals gain expertise in data visualization. A data analyst course in Pune equips learners with hands-on experience to work with Tableau Desktop and Tableau Server effectively.

    What is Tableau Desktop?

    Tableau Desktop is a standalone application that allows users to create interactive and dynamic visualizations. It is designed for individual analysts who need to work with data, create dashboards, and generate reports. Users can efficiently connect to various data sources, manipulate datasets, and develop insightful visual representations.

    One of the primary advantages of Tableau Desktop is its user-friendly interface and drag-and-drop functionality. It enables users to build compelling dashboards without requiring extensive coding knowledge. A data analyst course introduces professionals to Tableau Desktop’s functionalities, ensuring they can design impactful reports. A data analyst course in Pune offers practical exposure to working with datasets, improving analytical capabilities.

    Tableau Desktop also allows for deep data exploration, enabling users to apply filters, conduct trend analyses, and perform advanced calculations. The flexibility of Tableau Desktop makes it a preferred choice for analysts who work with data on a project basis and do not require collaborative sharing features.

    What is Tableau Server?

    Tableau Server is a web-based platform that widely allows organizations to share, manage, and collaborate on Tableau dashboards and reports. Unlike Tableau Desktop, which is used by individual users, Tableau Server enables multiple users to access and interact with visualizations simultaneously. This feature is particularly useful for various organizations with large teams that need real-time insights.

    Tableau Server provides enhanced security, ensuring that sensitive data remains protected. Organizations can control user permissions, restricting access to certain reports based on roles and responsibilities. A data analyst course covers Tableau Server’s capabilities, teaching professionals how to manage and publish dashboards effectively. A data analyst course in Pune provides hands-on training, enabling learners to work with Tableau Server in real-world scenarios.

    Another key advantage of Tableau Server is its ability to integrate with enterprise systems and cloud platforms, allowing seamless data sharing and collaboration. Businesses that require centralized data access and management often prefer Tableau Server over Tableau Desktop.

    data analyst

    Key Differences Between Tableau Desktop and Tableau Server

    While both Tableau Desktop and Tableau Server serve different purposes, understanding their key differences helps in making an informed decision. Tableau Desktop is ideal for individual data analysts who need to create visualizations and reports independently. On the other hand, Tableau Server is designed for organizations that require collaboration and secure data sharing.

    A data analyst course explores these differences in-depth, helping learners choose the right tool based on their needs. A data analyst course in Pune provides comparative analysis exercises, ensuring professionals gain expertise in both platforms.

    Tableau Desktop is primarily used for data exploration and visualization creation, whereas Tableau Server focuses on publishing, managing, and sharing dashboards. While Tableau Desktop allows for local file storage, Tableau Server ensures that all reports and dashboards are stored in a centralized location, enhancing accessibility.

    Which One Should You Choose?

    The choice between Tableau Desktop and Tableau Server depends on individual and organizational requirements. If you are an individual data analyst who needs to create reports independently, Tableau Desktop is the ideal choice. However, if you work in a team or an organization that requires collaborative data sharing, Tableau Server is more suitable.

    A data analyst course helps professionals assess their requirements and select the appropriate tool. A data analyst course in Pune provides hands-on training, allowing learners to work with both Tableau Desktop and Tableau Server in practical scenarios.

    Organizations that handle large datasets and require secure, real-time collaboration often prefer Tableau Server. Meanwhile, analysts who perform deep data exploration and need offline access to their visualizations may find Tableau Desktop more convenient.

    Benefits of Learning Tableau Desktop and Server

    Mastering Tableau Desktop and Tableau Server offers several benefits for data analysts and business intelligence professionals. These tools enhance data visualization skills, making it easier to communicate insights effectively. Additionally, proficiency in Tableau increases career opportunities, as many industries rely on data-driven decision-making.

    A data analyst course provides structured training in Tableau, helping learners develop expertise in data visualization. A data analyst course in Pune offers practical exposure, ensuring professionals can work with Tableau Desktop and Tableau Server confidently.

    Learning Tableau also improves analytical capabilities, allowing professionals to derive actionable insights from complex datasets. Organizations benefit from improved data-driven strategies, leading to better business outcomes.

    Real-World Applications of Tableau Desktop and Server

    Various industries use Tableau Desktop and Tableau Server to drive business intelligence and decision-making. In finance, these tools help analysts track investments, assess risks, and monitor market trends. In healthcare, Tableau is used for patient data analysis, resource allocation, and disease tracking.

    Retail businesses use Tableau to analyze customer behavior, optimize inventory, and improve sales performance. Marketing professionals leverage Tableau for campaign analysis, audience segmentation, and performance tracking.

    A data analyst course covers these real-world applications, helping professionals apply their skills in different industries. A data analyst course in Pune includes practical case studies, enabling learners to work on industry-specific datasets.

    Challenges in Using Tableau Desktop and Server

    Despite their advantages, Tableau Desktop and Tableau Server come with certain challenges. Tableau Desktop has a licensing cost that may be expensive for individual users. Additionally, it requires a learning curve to fully utilize its advanced features.

    Tableau Server, while useful for collaboration, requires IT expertise for setup and maintenance. Organizations must ensure proper data governance and security protocols when using Tableau Server.

    A data analyst course addresses these challenges, equipping learners with the knowledge to use Tableau effectively. A data analyst course in Pune provides best practices for overcoming common issues faced while working with Tableau Desktop and Tableau Server.

    Future Trends in Data Visualization with Tableau

    The field of data visualization is constantly evolving, and Tableau continues to introduce new features to enhance analytics capabilities. AI-powered analytics, real-time data processing, and automated reporting are some of the emerging trends in Tableau.

    Cloud-based Tableau solutions are gaining popularity, allowing organizations to access and analyze data from anywhere. Interactive dashboards and AI-driven insights are becoming more prevalent, improving business intelligence capabilities.

    A data analyst course prepares professionals for these future trends, ensuring they stay ahead in the competitive analytics landscape. A data analyst course in Pune offers training on the latest Tableau advancements, helping learners build future-ready skills.

    Conclusion

    Tableau Desktop and Tableau Server are powerful data visualization tools that cater to different needs. Tableau Desktop is ideal for individual data analysts who create reports, while Tableau Server is designed for organizations that require secure, collaborative data sharing.

    Enrolling in a data analyst course provides a strong foundation in Tableau, equipping professionals with the skills needed to use these tools effectively. A data analyst course in Pune offers hands-on training, ensuring learners are prepared for the dynamic world of data analytics. As businesses significantly continue to rely on data-driven insights, mastering Tableau Desktop and Tableau Server opens new career opportunities in data analytics.

    Business Name: ExcelR – Data Science, Data Analyst Course Training

    Address: 1st Floor, East Court Phoenix Market City, F-02, Clover Park, Viman Nagar, Pune, Maharashtra 411014

    Phone Number: 096997 53213

    Email Id: enquiry@excelr.com

  • Building Predictive Analytics Models Using Prophet for Time Series Forecasting

    Building Predictive Analytics Models Using Prophet for Time Series Forecasting

    In the modern era of data-driven decision-making, predictive analytics plays a crucial role in understanding future trends, demand forecasting, and optimising various business operations. One of the most efficient and widely used tools for time series forecasting is Prophet, an open-source tool developed by Facebook. This article will explore how you can build predictive models using Prophet for time series forecasting. By the end, you will gain insights into how to utilise this tool effectively and efficiently. Whether you’re looking to enhance your data science skills or gain practical experience in predictive analytics, a data science course in Mumbai can provide you with the necessary foundation.

    Understanding Time Series Forecasting

    Time series forecasting predicts future values based on historical data collected over time. This type of analysis is particularly useful in areas like stock market prediction, sales forecasting, weather prediction, and resource allocation. With the advancement of data science, time series forecasting has become an indispensable part of business strategy and operational efficiency.

    Regarding time series forecasting, several algorithms and models are available, but Prophet stands out because of its simplicity, scalability, and ease of use. By taking a data scientist course, you’ll develop a strong grasp of techniques like Prophet, which can help create robust time series forecasting models.

    What is the Prophet?

    Prophet is a forecasting tool designed to handle the complexities and nuances of time series data. Developed by Facebook’s Core Data Science team, Prophet is specifically designed for use cases where the data has strong seasonal effects and multiple seasons of historical data. This tool can efficiently handle missing data, outliers, and holiday effects.

    Prophet is built on top of Stan, a state-of-the-art probabilistic programming language, and is implemented in both Python and R. It is intuitive, easy to use, and provides high-quality results with minimal configuration. Those pursuing a data scientist course can expect to gain expertise in utilising Prophet effectively for diverse applications in data analytics.

    Key Features of Prophet

    Some of the key features of Prophet that make it popular for time series forecasting include:

    • Automatic Seasonality Detection: Prophet can automatically detect and model daily, weekly, and yearly seasonal effects without requiring much user input.
    • Flexibility: It allows users to include holidays, events, and special occasions in the model, which can significantly improve accuracy.
    • Outlier Handling: Prophet is robust to missing data and outliers, making it ideal for real-world, messy datasets.
    • Scalability: It is designed to easily handle large datasets, which is a common requirement in business environments.

    data analyst

    For those enrolled in a data scientist course, familiarity with these features will help you confidently tackle real-world time series forecasting problems.

    Step-by-Step Guide to Building a Time Series Forecasting Model Using Prophet

    Step 1: Import Libraries

    The first step in any data science project is to import the necessary libraries. For Prophet, we need to import the Prophet library and other essential Python libraries like pandas, matplotlib, and numpy.

    from fbprophet import Prophet

    import pandas as PD

    import matplotlib.pyplot as plt

    The Prophet library is essential for time series forecasting, pandas help with data manipulation, and Matplotlib visualises results.

    Step 2: Preparing the Data

    Prophet requires the data to be in a specific format: a data frame with two columns: one for the dates and another for the values we want to forecast. The column names must be ds for the date and y for the target value.

    data = pd.read_csv(‘your_time_series_data.CSV)

    data[‘ds’] = pd.to_datetime(data[‘ds’])  # Ensuring the date column is in datetime format

    Before applying Prophet, it is important to clean and preprocess the data. This includes handling missing values, checking for outliers, and properly formatting the date column.

    Step 3: Fitting the Model

    Once the data is prepared, the next step is to fit the Prophet model. Prophet allows us to configure various parameters such as seasonality, holidays, and even additional regressors.

    model = Prophet()

    model.fit(data)

    In this case, the model is fitted to the data, including the date and value columns. Depending on the business’s specific needs, you can customize the model further by incorporating holidays and additional seasonalities.

    Step 4: Making Predictions

    After the model is trained, the next step is to predict future dates. This can be achieved by creating a data frame with future dates and using the prediction method.

    future = model.make_future_dataframe(data, periods=365)  # 365 days of future predictions

    forecast = model.predict(future)

    The make_future_dataframe function creates a DataFrame with future dates, and the predict function generates predictions for those dates. The result is a DataFrame containing the forecasted values and uncertainty intervals.

    Step 5: Visualising the Results

    Once the predictions are made, it’s crucial to visualise them to understand the model’s performance better. Prophet provides an in-built plotting function to visualise the forecasted data.

    model.plot(forecast)

    plt.show()

    This visualisation allows us to compare the historical data with the forecasted data, including the confidence intervals for the predicted values. This step is essential for evaluating the model’s accuracy and understanding how well it fits the data.

    Step 6: Model Evaluation

    To evaluate the performance of the predictive model, you should use metrics like Mean Absolute Error (MAE), Mean Squared Error (MSE), and Root Mean Squared Error (RMSE). These metrics help in assessing the accuracy of the forecast.

    from sklearn.metrics import mean_absolute_error

    mae = mean_absolute_error(actual_data, forecast[‘yhat’])

    print(f’Mean Absolute Error: {mae}’)

    These metrics can help refine the model by tuning hyperparameters or adding more features, such as holidays or additional regressors.

    Why Choose Prophet for Time Series Forecasting?

    Prophet stands out in time series forecasting due to its simplicity and flexibility. It is designed for use by business analysts, data scientists, and developers alike, making it accessible to various users. Prophet is the go-to tool if you want to build predictive models without getting lost in complex configurations. For those taking a data science course in Mumbai, learning Prophet will enable you to handle complex forecasting problems easily.

    Conclusion

    Building predictive analytics models using Prophet is an essential skill for anyone working in data science, particularly for time series forecasting tasks. Its simplicity, robustness, and flexibility make it an ideal tool for forecasting trends in sales, demand, stock prices, and more. By understanding how to preprocess data, fit models, make predictions, and visualise results, you can unlock valuable insights from time series data.

    For those looking to sharpen their skills in predictive analytics, enrolling in a data science course in Mumbai will provide you with the theoretical background and hands-on experience with powerful tools like Prophet. This combination of practical knowledge and real-world application will open doors to various data science and analytics opportunities.

    Business Name: ExcelR- Data Science, Data Analytics, Business Analyst Course Training Mumbai
    Address:  Unit no. 302, 03rd Floor, Ashok Premises, Old Nagardas Rd, Nicolas Wadi Rd, Mogra Village, Gundavali Gaothan, Andheri E, Mumbai, Maharashtra 400069, Phone: 09108238354, Email: enquiry@excelr.com.

  • Transforming Industries – How Robotics and Automation are Changing B.Tech Mechanical Engineering

    Transforming Industries – How Robotics and Automation are Changing B.Tech Mechanical Engineering

    Mechanical engineering is slowly influenced by robotics and automation as all industries work effectively through it. To get the best of both fields in your B.Tech, read why you should choose MIT-WPU!

    The Rise of Robotics in B.Tech Mechanical Engineering

    Robotics is not a specific field anymore because it’s also finding its way into other majors like mechanical engineering. B.Tech programmes integrate courses like robot kinematics, control systems, sensor technologies, and more to design intelligent machines. Other specialised elective papers focus on industrial automation and medical and humanoid robotics, which are for other fields.  

    Robotics application is no longer a theory; many startups and companies are involved in full-time robotics across industries. As a student, you can work on robotic platforms and experiment with real-time simulations by contesting in robotics championships to gain experience for future work roles. You can design robots for delicate surgeries and other industrial processes and make a career in research and development, automation and more, making way for a robotic-savvy future.  

    The transformation in the mechanical engineering field is fundamental and happening fast, shaping a new future in machinery design and execution. 

    Automation’s Impact on B.Tech Mechanical Engineering

    • The shift in focus: Integrating courses in robotics, control systems, data analysis and automation, and original mechanical engineering principles.  
    • New skillset: The updated curriculum can help students design and build more automated machines than manual mechanical units.  
    • Practical application: Hands-on applications with robots and simulation can help students build automated tech systems more efficiently.  

    Career opportunities: 

    There’s a higher demand for graduates who excel in automation to optimise the processes of automated manufacturing, developing robots and more. This creates career opportunities in research, development, implementation and leading automation development.  

    Automation is changing the mechanical engineering field, making the job market stiffer; hence, graduates have knowledge or a basic understanding of automated processes. Also, this field is expected to grow for at least the next ten years. Therefore, automation in mechanical engineering is a new trend and students and professionals must keep upgrading.  

    How do robotics and automation help industries?

    Increased efficiency and productivity:  

    • Robotics and automation can perform tasks better and faster with consistency than manual labour, leading to increased output and reduced production time.   
    • They can handle more complex and dangerous tasks than humans.   

    Improved quality and consistency:  

    • Robots can perform all tasks with high precision with few to no defects for which they are programmed.  
    • There will be consistency and product uniformity across all sectors.   

    Cost reduction:   

    • While the initial costs are higher, lost-term investments in robotics are cost-effective, as they reduce labour.  
    • It can also streamline processes and optimise resource availability by further reducing costs.   

    Enhanced safety:  

    • Robots can be programmed to perform hazardous tasks or work in dangerous environments, protecting humans from injury or illness.  
    • There can be no human error, and the number of accidents will be reduced.   

    Greater flexibility and adaptability:  

    • Robots and automated systems can be easily reprogrammed and adapted to the evolving market needs and designs.   
    • This flexibility allows companies to respond to the market and stay afloat among the competitors.   

    New product development and innovation:   

    • Products and processes that are difficult to make possible through manual labour are now accessible.   
    • Robotics is finding its way into research and development processes for improved chances of discovery.   

    Note that the benefits vary according to industry, including the costs and timing. Successful integration requires careful planning and support, which students can get through proper course electives and hands-on training. Integrating robotics and automation requires careful planning, training, and ongoing support.  


    Benefits Of Robotics & Automation in Industries 

    With the evolving industrial landscape, robotics and automation have helped companies stay competitive and meet market demands. Increased efficiency, productivity, 24/7 operations with minimal errors and uniformity are the benefits so far. Cost reduction and tackling hazardous tasks are also effectively handled, especially by chemical industries. New product development and innovation are fast-tracked with robotics and automation for a highly advanced tech future! 

    To land a high-paying job in the leading industries in India with integrated knowledge in robotics and mechanical engineering, join MIT-WPU!  

    FAQs 

    How are collaborative robots enhancing safety in B.Tech Mechanical Engineering? 

    B.Tech Mechanical Engineering integrates cobots for safe interaction and hands-on learning, preparing future engineers for human-robot collaboration in industry. 

    What is the role of digital twin technology in mechanical engineering? 

    Digital twins in mechanical engineering act as virtual replicas, mirroring real-world machines to predict performance, optimise design, and enable proactive maintenance for improving efficiency.  

    How does automation contribute to cost-effective solutions in manufacturing? 

    Automation reduces production costs through 24/7 operation, minimises errors and waste, and frees up workers for higher-value tasks, paving the way for cost-effective measures.